機械学習がどんなものかを学ぶビデオ・レッスンです。
機械学習が何をしようとしているのかをコーディングを通して、教えてくれます。
GoogleのJosh Gordonさんのレッスンでシリーズものになっています。
その2回目
決定木を可視化する- 機械学習2
以下はムービーの説明を補足するヘルプです
iris flower dataset を使った決定木の可視化お話です。
Data Setの項の[show]をクリック
ムービーの中で使われているコード
【test2.py】
|
1 2 3 4 5 6 7 8 |
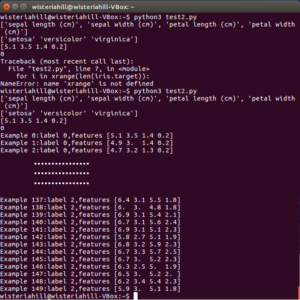
from sklearn.datasets import load_iris iris = load_iris() print(iris.feature_names) print(iris.target_names) print(iris.data[0]) print(iris.target[0]) for i in range(len(iris.target)): print("Example %d:label %s,features %s" % (i, iris.target[i], iris.data[i])) |
$python3 test2.py
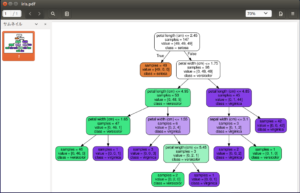
可視化したグラフを作成
コードはpython3用に、ムービーのコードを少し変更しています。
依存ライブラリをインストールしておきます。
$pip3 install pydotplus
$sudo apt-get install graphviz
【test3.py】
|
1 2 3 4 5 6 7 8 9 10 11 12 13 14 15 16 17 18 19 20 21 22 23 24 25 26 27 28 29 30 31 32 |
import numpy as np from sklearn.datasets import load_iris from sklearn import tree iris = load_iris() test_idx = [0,50,100] #tarining data train_target = np.delete(iris.target,test_idx) train_data = np.delete(iris.data,test_idx,axis = 0) #testing data test_target = iris.target[test_idx] test_data = iris.data[test_idx] clf = tree.DecisionTreeClassifier() clf.fit(train_data,train_target) print(test_target) print(clf.predict(test_data)) #viz code from sklearn.externals.six import StringIO import pydotplus dot_data = StringIO() tree.export_graphviz(clf, out_file=dot_data, feature_names=iris.feature_names, class_names=iris.target_names, filled=True,rounded=True, impurity=False) graph = pydotplus.graph_from_dot_data(dot_data.getvalue()) graph.write_pdf("iris.pdf") |
$python3 test3.py


Leave a Reply